How to win the Ironman World Championship – the best Kona run strategy
Pacing in Kona - how to win and how to avoid blowing up
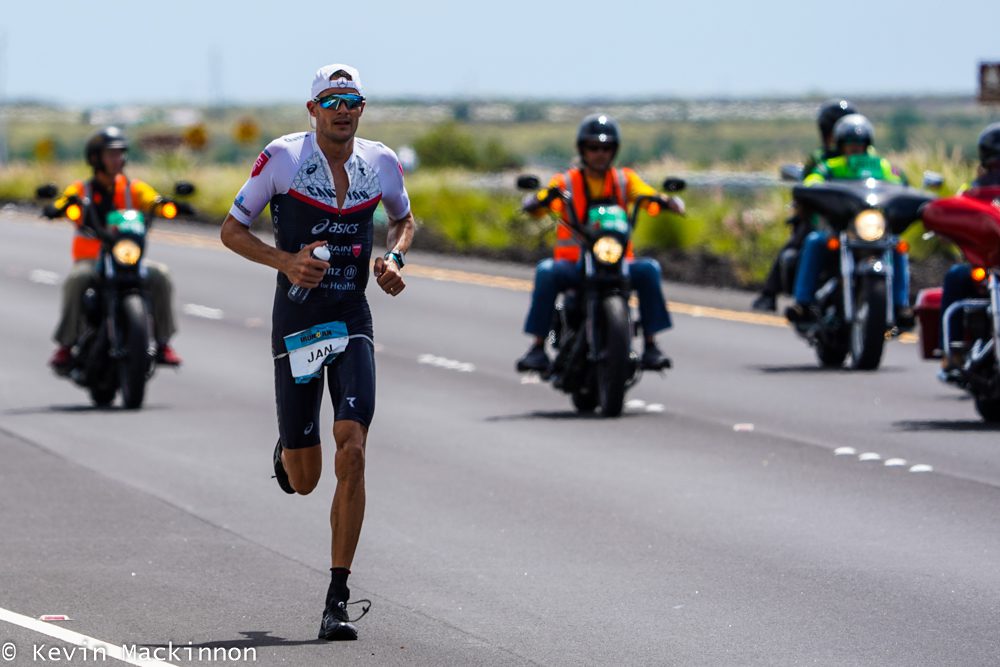 Photo by:
Kevin Mackinnon
Photo by:
Kevin Mackinnon
“Bike for show, run for dough” has been one of the mantras of Ironman racing, especially in Kona. There have been very few occasions where a superb performance on the bike has secured a Kona title; almost all races have been decided by the athlete with the best marathon.
But what is the best approach for pacing the run? Go out quick and give yourself a lead going into the second half? Or start a bit easier, saving your legs for the final 10 km? A look at intermediate run splits from some of the leading athletes at Kona in 2018 and 2019 provide some common themes and the implications of the data for future races.
Running to win: How the winners do it
In order to discuss different pacing strategies, we use pacing charts to show how athletes raced the Kona marathon. These show the pace of an athlete for eight segments of the marathon (3⅓ miles each, except for a shorter closing section). These paces have been calculated from the official timing mats in Kona. As the number and position of these mats changes from year to year, sometimes a bit of tweaking is needed to make the data comparable between different years.
The second twist is the “0 to 10 mile pace” that we use as a basis for comparing the different segments. The first 10 miles give a good indication of the “best case scenario:” Almost everyone starts out a bit quick on relatively fresh legs. That section, though, also includes not just the section on Ali’i Drive along the ocean (rolling, but relatively flat, with lots of spectators and a slightly cooling breeze), but also the big uphill on Palani Road (at about mile 7.2 of the current run course) and a few more rollers on the hot Queen K Highway. Overall, the first ten miles are a good indication of the tough conditions on the Kona run course.
To start, we’ll take a look at the pacing data from the male and female champions in 2018 and 2019 (Table 1 and Figure 1).
Table 1. Marathon pacing data from the male and female winners at Kona in 2018 and 2019.
| Athlete (Year) | 0-10 mile pace
(min/mile) |
10-26.2 mile pace
(min/mile) |
Slow-down | Projected marathon time @ 0-10 mile pace | Actual marathon time |
| Jan Frodeno (2019) | 05:57 | 06:22 | 7.0% | 02:35:59 | 02:42:43 |
| Patrick Lange (2018) | 06:03 | 06:14 | 2.9% | 02:38:38 | 02:41:32 |
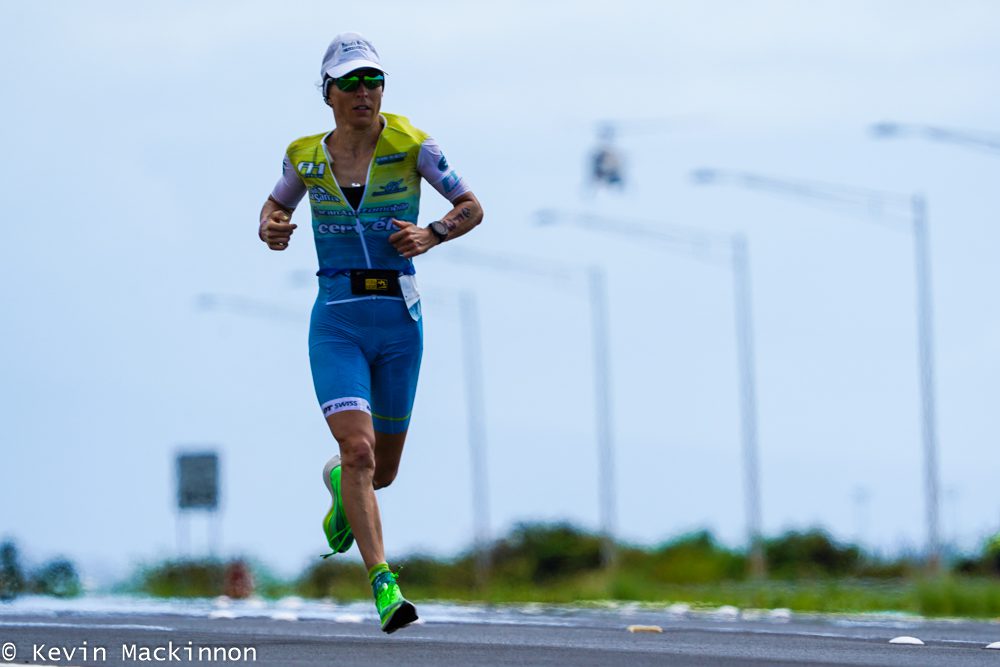
| Anne Haug (2019) | 06:18 | 06:40 | 5.9% | 02:45:06 | 02:51:07 |
| Daniela Ryf (2018) | 06:35 | 06:52 | 4.5% | 02:52:16 | 02:57:05 |

Figure 1. Marathon pacing strategy of the male and female champions in Kona in 2018 and 2019. On the y-axis, we have the difference in pace per mile for each 3⅓-mile segment compared to their average pace over the first 10 miles. Therefore, a high point on the graph indicates that the athlete ran that segment slower than their 0-10 mile pace.
There are a few key points to note when looking at this data from four of the best Ironman athletes (and runners) on the planet. The first part of the graph is along Ali’i Drive, and is typically the fastest part of the marathon – for these athletes and in most others. Sometimes we see athletes push extra hard on this section for tactical reasons, e.g. Frodeno in 2019 and Ryf in 2018, who were looking to add to their T2 lead and put some breathing space between them and their nearest competitors. Pace is also impacted by hills; in particular the one on Palani at mile 7.2, but also the rollers on Queen K.
Closing a fast marathon
This next pacing chart shows some of the best closers in the business; these are the athletes who ran fast marathons with fast second halves (Table 2 and Figure 2).
Table 2. Marathon pacing data from athletes who closed out the marathon in Kona effectively.
| Athlete (Year) | 0-10 mile pace
(min/mile) |
10-26.2 mile pace
(min/mile) |
Slow-down | Projected marathon time @ 0-10 mile pace | Actual marathon time |
| Ben Hoffman (2019) | 06:09 | 06:16 | 1.9% | 02:41:13 | 02:43:08 |
| Joe Skipper (2019) | 06:35 | 06:39 | 1.0% | 02:52:29 | 02:53:30 |
| Corinne Abraham (2019) | 06:45 | 06:55 | 2.5% | 02:56:43 | 02:59:28 |
| Matthew Russell (2018) | 06:30 | 06:40 | 2.5% | 02:50:18 | 02:52:57 |
| Anne Haug (2018) | 06:36 | 06:45 | 2.4% | 02:52:45 | 02:55:21 |
| Angela Naeth (2018) | 07:19 | 07:17 | -0.4% | 03:11:42 | 03:11:12 |
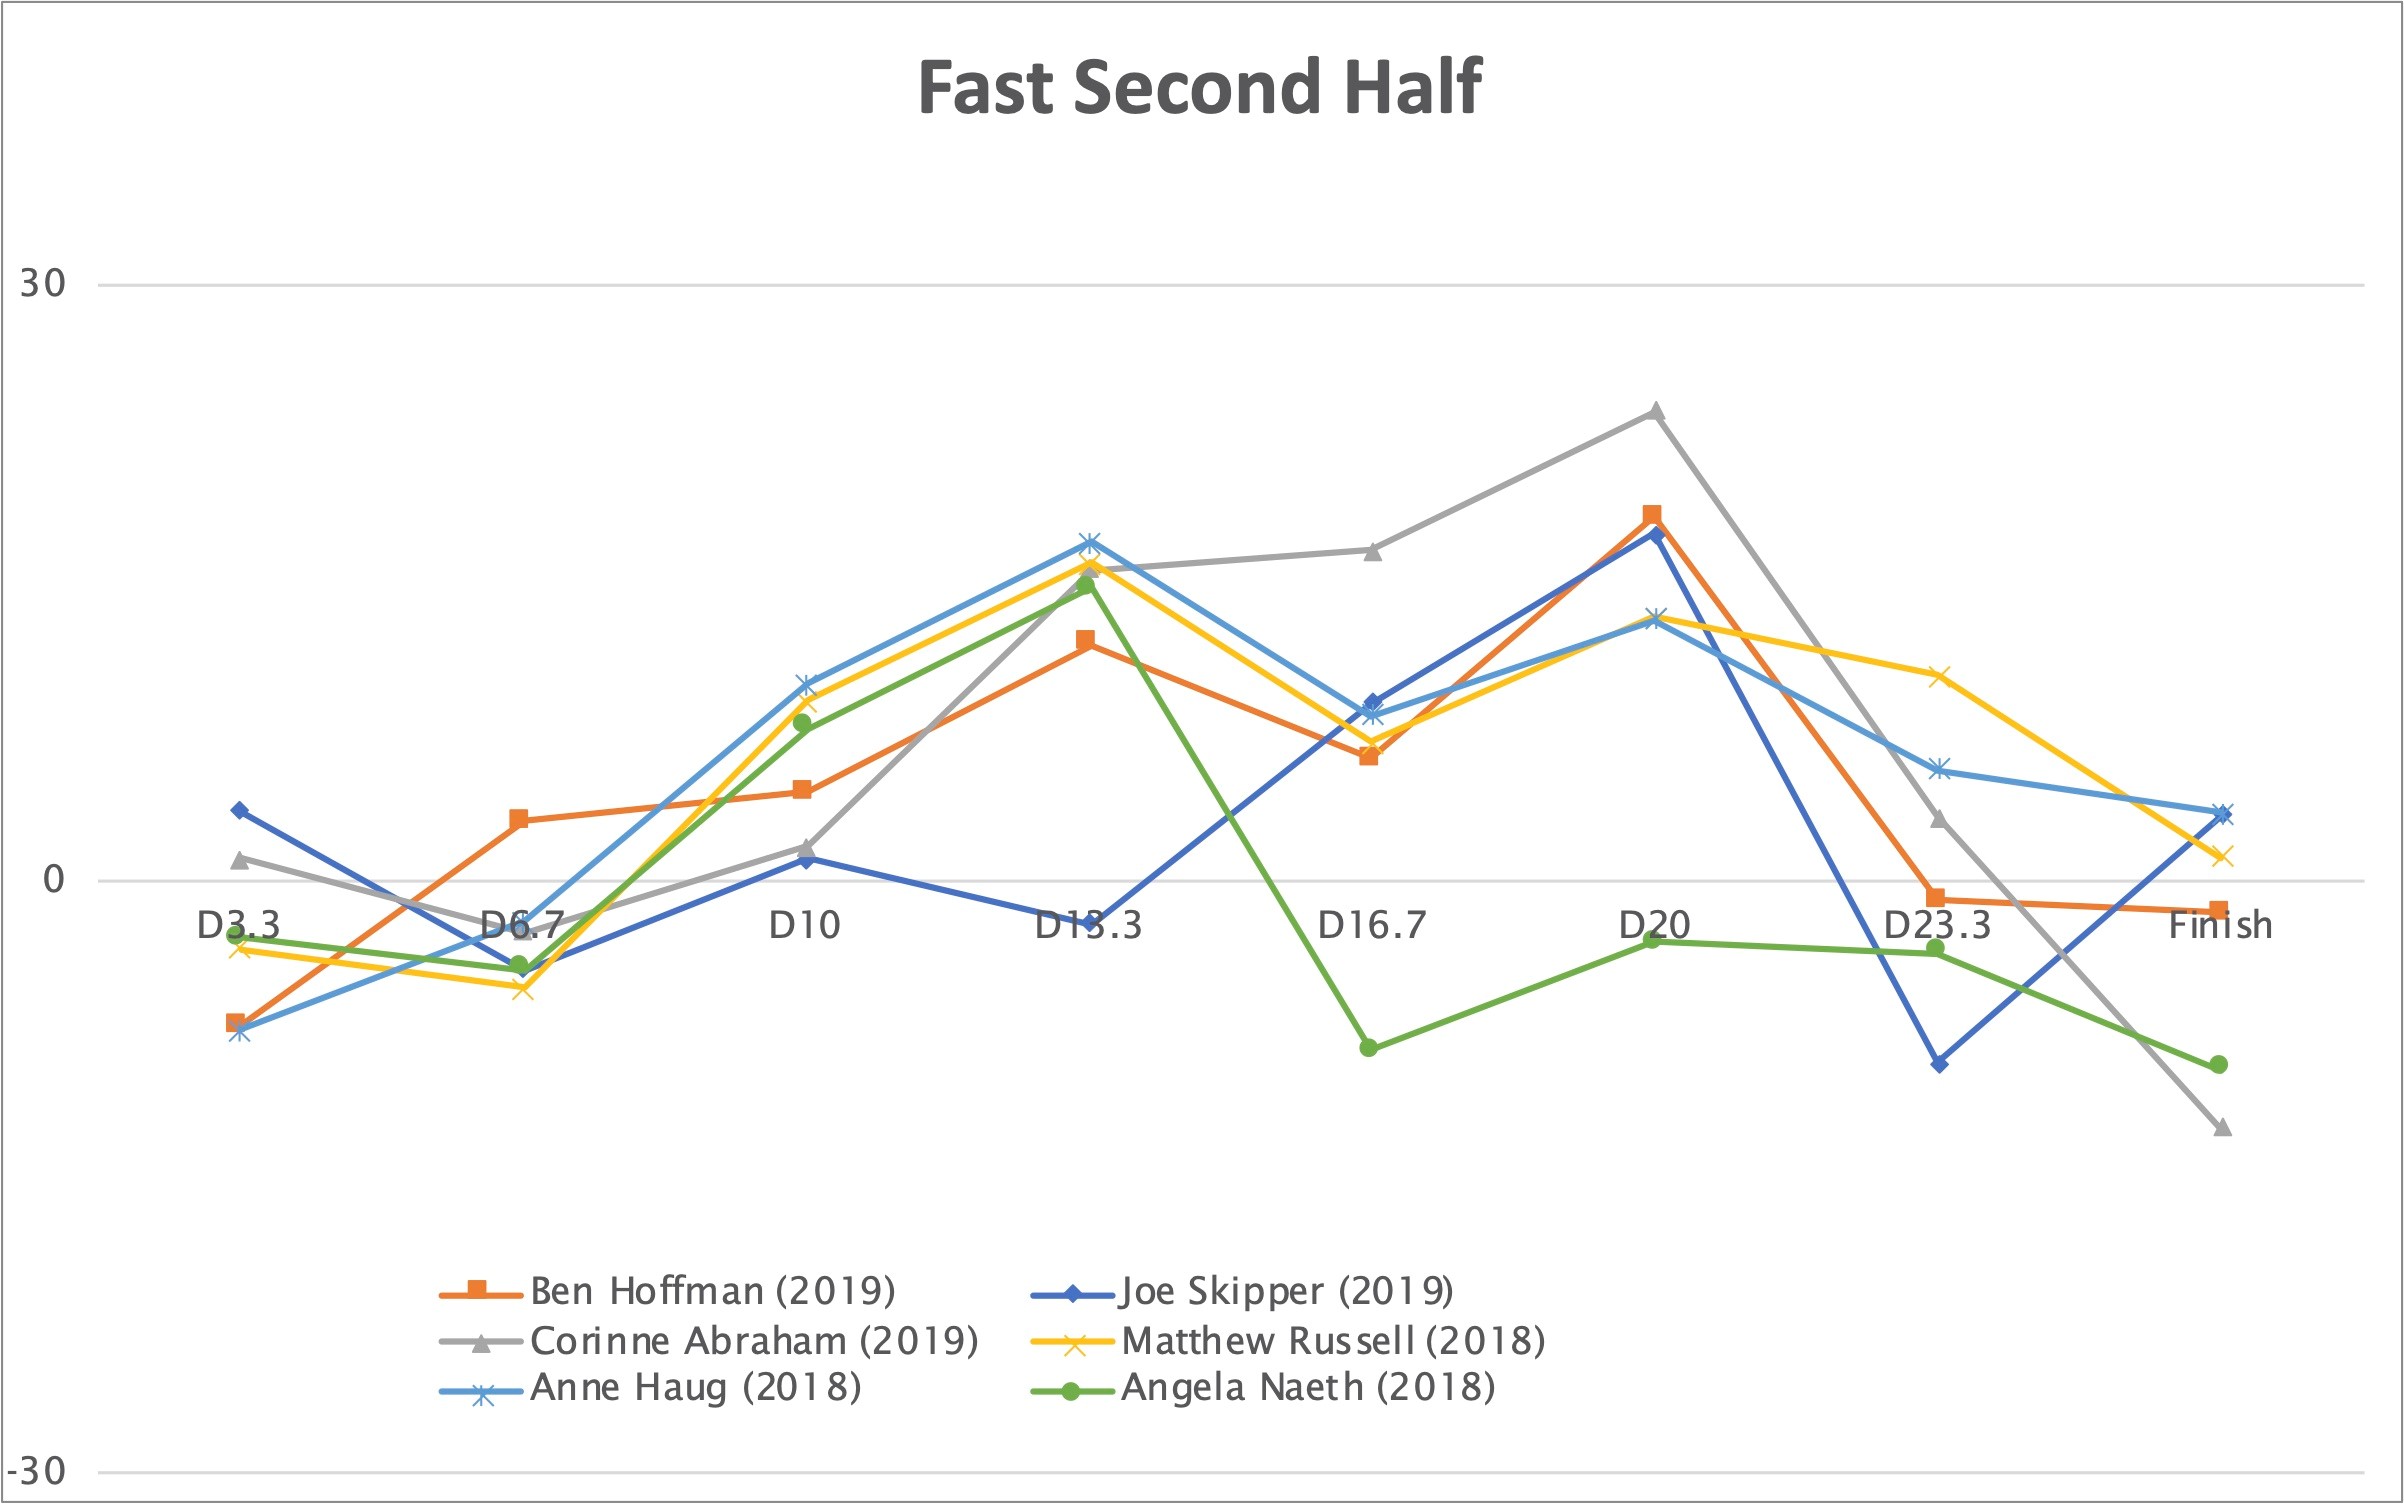
Figure 2. Marathon pacing strategy of selected athletes from Kona in 2018 and 2019 who closed effectively or had a fast second half.
The first thing to notice about the data here is that these athletes had “flat” pacing curves; that is, their pace throughout the entire marathon compared to the first 10 miles was very consistent. Compared to the winners, these athletes were pretty conservative out of T2, but this strategy may have left them a little more in the tank for the second half, with much less “slow down” (-0.4-2.5% vs. 2.9-7.0%). These athletes were even able to accelerate at the end, with pace over the last couple of miles similar to, or even faster than, the first 10 miles.
Those who blew up
In contrast, these are the figures of the athletes who “blew up”; that is, they slowed down massively after 10 miles (Table 3, Figure 3).
Table 3. Marathon pacing data from athletes who slowed dramatically in the second half of the Kona marathon.
| Athlete (Year) | 0-10 mile pace (min/mile) | 10-26.2 mile pace
(min/mile) |
Slow-down | Projected marathon time @ 0-10 mile pace | Actual marathon time |
| Alistair Brownlee (2019) | 06:21 | 08:00 | 25.9% | 02:46:20 | 03:13:00 |
| Lionel Sanders (2019) | 06:26 | 07:59 | 24.3% | 02:48:25 | 03:13:42 |
| Daniela Ryf (2019) | 06:32 | 08:21 | 27.9% | 02:51:05 | 03:20:36 |
| Lauren Brandon (2019) | 08:04 | 10:28 | 29.7% | 03:31:21 | 04:10:13 |
| Lionel Sanders (2018) | 06:35 | 08:00 | 21.6% | 02:52:26 | 03:15:26 |
| James Cunnama (2018) | 06:09 | 07:26 | 20.7% | 02:41:18 | 03:02:00 |
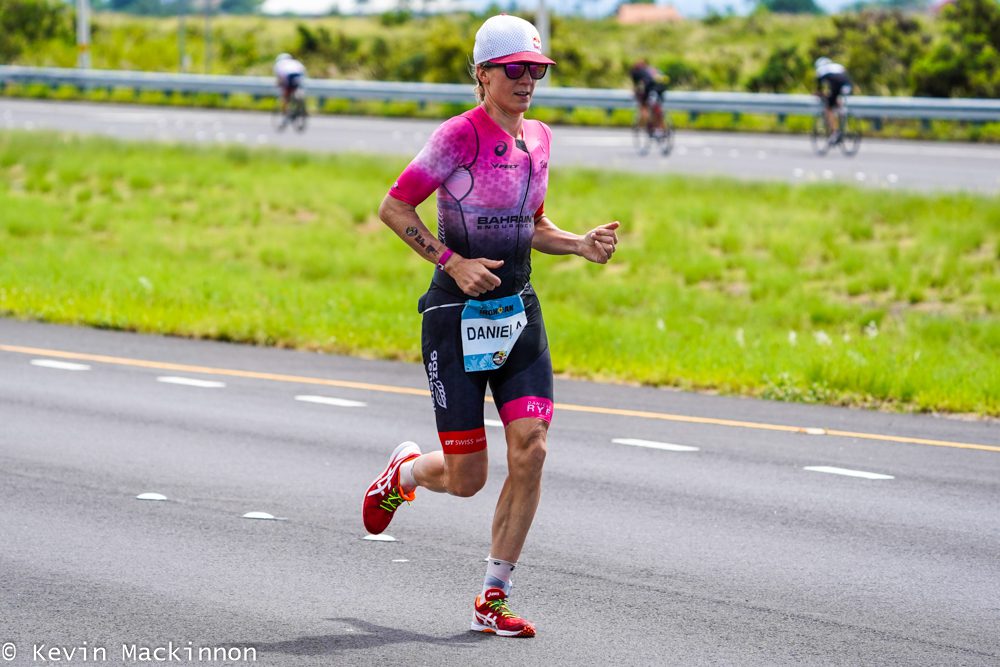
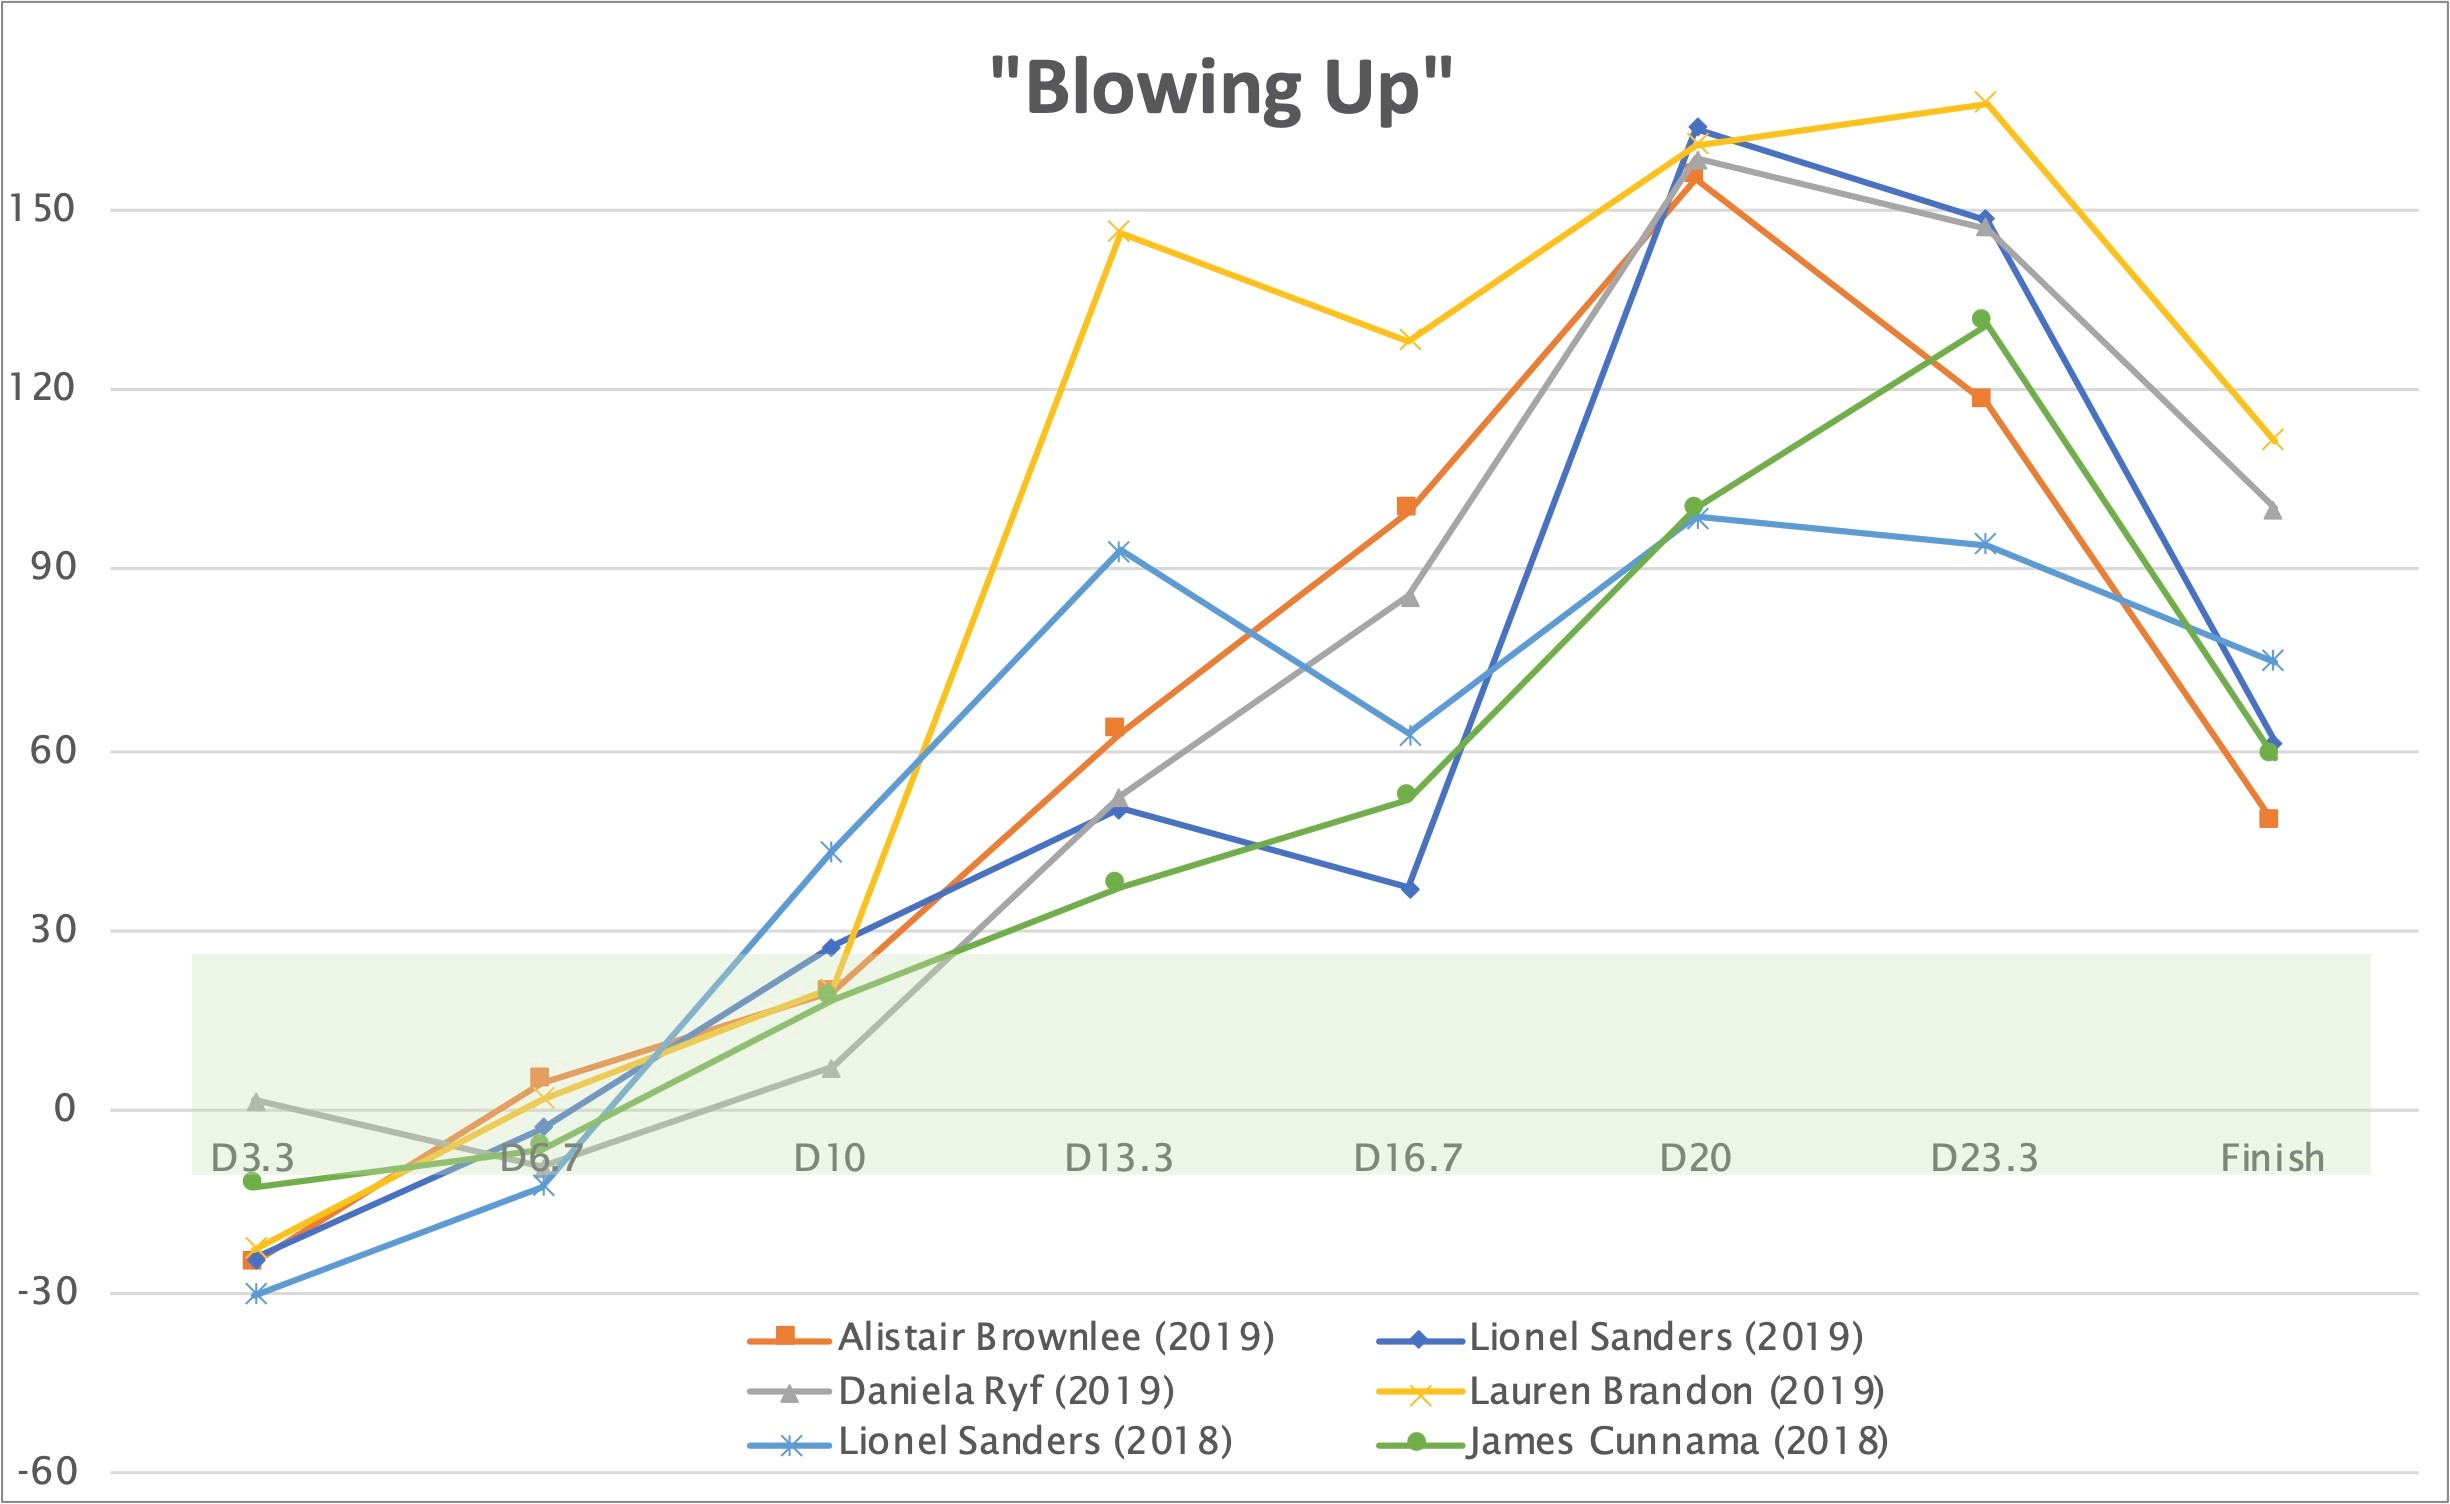
Figure 3. Marathon pacing strategy of selected athletes from Kona in 2018 and 2019 who slowed down dramatically during the second half. Note the scale of the y-axis is much larger here, so the high points indicating slowed pace of more than 2:30 per mile.
Before trying to interpret this data, it’s important to look at the y-axis; the scale goes all the way up to a slowing of 150 seconds (or 2:30 minutes) per mile, and all the athletes get above this. The green shaded area highlights the axis as it was drawn on the other charts. When considering this, it’s obvious just how much these athletes “blew up” and slowed down massively after 10 miles. What’s noticeable is the slowing of pace in these athletes is apparent by 10 miles, and then just gets worse and worse – not a winning strategy. Sure, they were able to speed up a little for the finish, but by this point the damage was already done. The heat probably played a big factor for these athletes.
Why did this happen? Getting into the Physiology
It is worth discussing here some of the physiology behind the pacing responses we see. As many of you will know, one of the key factors at play during the Ironman World Championship is the high heat and humidity, and the effects that environmental heat stress has on the body during racing. It is well established in the research that when we exercise in a hot environment we see much larger increases to our internal – core – temperature compared to when we perform that same exercise in cool conditions. Our core temperature increases when heat production, from exercising muscles, exceeds the rate of heat loss, primarily via sweating. The high heat and humidity in Kona drive up the heat load, and therefore our internal temperatures. Whilst our core temperature at rest may be ~37°C, during demanding exercise performed in high environmental temperatures it can rise to ~40°C, and in a 2019 study by Racinais, even higher (41.5°C). Rising core temperature will eventually become dangerous and is part of the pathophysiology of things like exertional heat illness. As such, rising internal temperatures are a crucial limiting factor to endurance performance in competitions taking place under high heat and humidity like the Ironman World Championship.
However, the interaction between heat stress and performance in the marathon in Kona is more complicated than athletes simply seeing a rise in core temperature to a certain set-point, and then blowing up. This is, in some ways, evidenced by the pacing data in this article, as even the athletes who “blew up” finished the race and even managed to speed up in the final few miles (Figure 3). It has been established by sports scientists such as Ross Tucker from the University of Capetown, that pacing in hot environments is linked to the physiological effects of heat stress via “anticipatory regulation.” Suggesting that our perception of the effort associated with producing a given power output seems to be regulated to some degree by the rate at which our core temperature is increasing. This theory is supported by a study published by Tucker in 2006. Here it was shown that when cyclists were asked to cycle at a given perceived effort in the heat, they produce less power right from the beginning of exercise, even though their core temperatures are not yet dangerously high. This suggests that we interpret the more rapid rise in core temperature associated with exercise in the heat as a “dangerous” signal, and so voluntarily reduce our power or pace to reduce the rate of heat production and therefore rate of heat storage.

Therefore, in the athletes we see in Figure 3, those who “blew up” in the marathon in Kona and really slowed at and around 10 miles, it’s possible that they initially overrode their body’s anticipatory regulation of their rising internal temperatures, and pushed on at a pace that was ultimately unsustainable. As internal temperatures continued to increase and increase at a rapid rate, they were eventually forced to slow their pace dramatically, in order to ensure that they made it to the finish line at all. In contrast, athletes who paced effectively and ran a fast marathon (Figures 1 and 2) likely selected an initial pace that was sustainable; that is, produced a rate of rise in core temperature that could be more-or-less sustained until the finish of the race, hence why the slowing of pace after 10 miles was much less dramatic. To put this into perspective, much “bolder” starting paces in temperate conditions are more likely to not end in catastrophic slowing of pace than in hot races. In hot races, although starting “somewhat” faster is manageable, how much needs to be much more carefully managed.
Practical applications: How should you pace a marathon in Kona?
This data, and our understanding of the physiology of racing under high environmental heat stress, gives us some insight into the strategies we might adopt when pacing our marathon in Kona.
Firstly, Kona is a beast and the marathon can make fools out of even the most distinguished triathletes. Therefore, we should keep fighting until the very end of the race; our competitors could blow up at any time and have to drastically reduce their pace if they have employed the wrong pacing strategy. To pace the marathon effectively, we need to have a realistic finishing time in our minds before the race, and not head off out of T2 any more than ~1.5 per cent faster than our target time. However, we should also be constantly interpreting our perception of the effort, our perception of the heat, and our heart rate because the environmental conditions of the race can change.
For instance, we may have predicted running the marathon at 4:15 minutes per kilometre, anticipating an environmental temperature of 32°C. However, if on the day the environmental temperature is actually up around 36 to 37°C, that realistic 4:15 pace would actually result in an unsustainable rate of heat storage. Therefore, having a “cap” on metrics like perceived effort and heart rate, which respond to the magnitude of the heat load, might be a useful means of ensuring our pacing strategy sees us through to the finish.
Bottom line: Kona is the ultimate game of patience, and a measured approach to the marathon will see you come out on top.
Daniel Plews PhD is a sports scientist and coach based in New Zealand (endureiq.com). Thorsten Radde is a triathlon data analyst based in Germany (trirating.com)
This story originally appeared in the July/ August issue of Triathlon Magazine Canada.